11. A YouTube performance issue
💡 Would you like more free lessons? Please subscribe on YouTube to show your support.
Lesson Details
- Lesson: 11
- Description: Running a performance profile on the YouTube.com search box
The goal of this lesson
To understand the cause of a performance issue on YouTube.com.
What we'll cover
- Introduction
- Reminder: How to perform a performance profile
- Looking at The performance profile
- Conclusion
Introduction
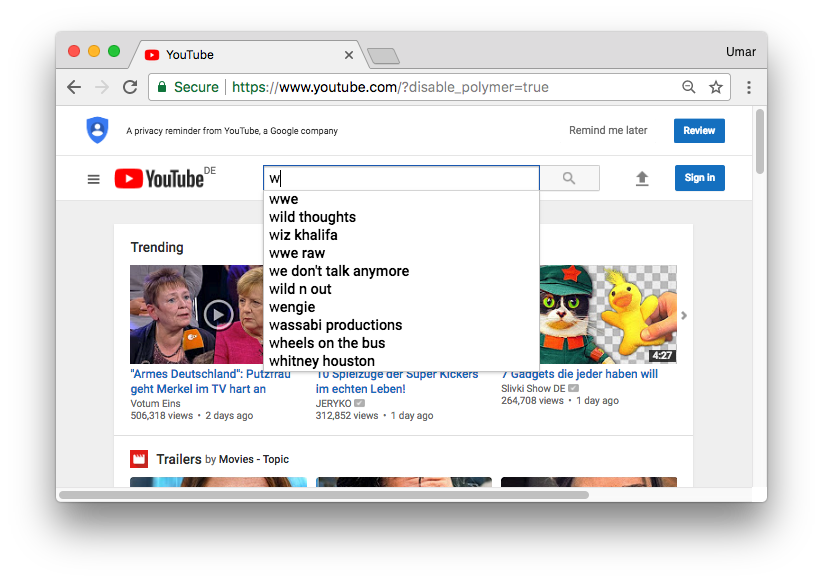
On YouTube.com there is a search box at the top of the page. When you start typing, you trigger autosuggest. Let's profile this.
Reminder: How to perform a performance profile
As a reminder, here are the steps to follow when investigating front-end performance issues.
- Identify the action which might be a bottleneck. E.g. scrolling the page, opening a drop down menu, resizing the browser etc. In this example, it is triggering the dropdown search on YouTube.
- Start a recording from the performance panel (ideally with CPU throttling turned on).
- Trigger the action identified in step #1.
- Stop the recording.
- Analyse the results.
Looking at The performance profile
Here is the performance profile of activating the search dropdown.
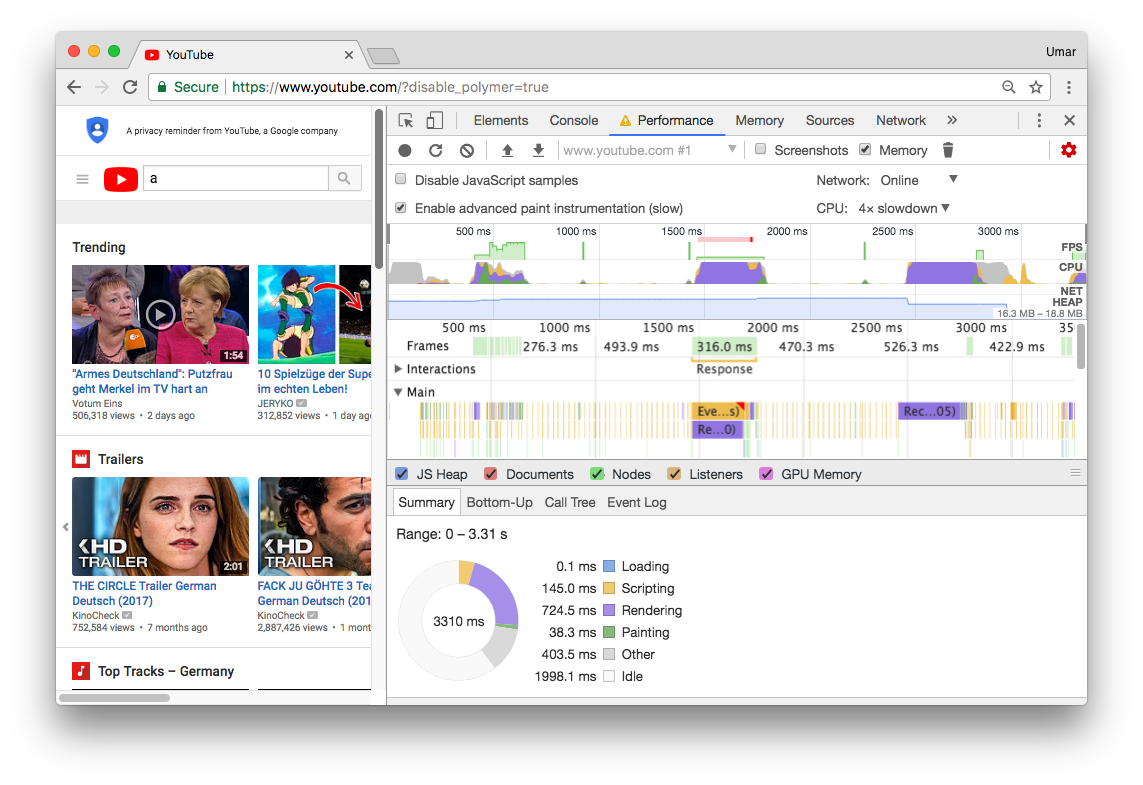
Zoom into one of the large "blocks" or "peaks".
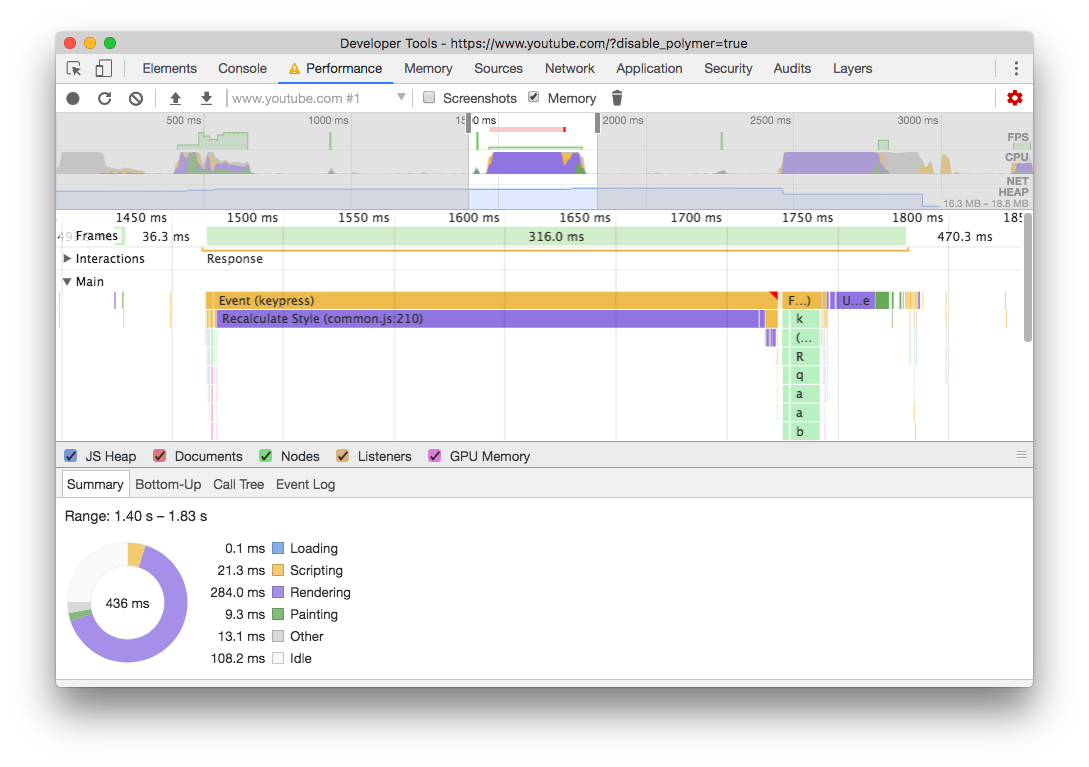
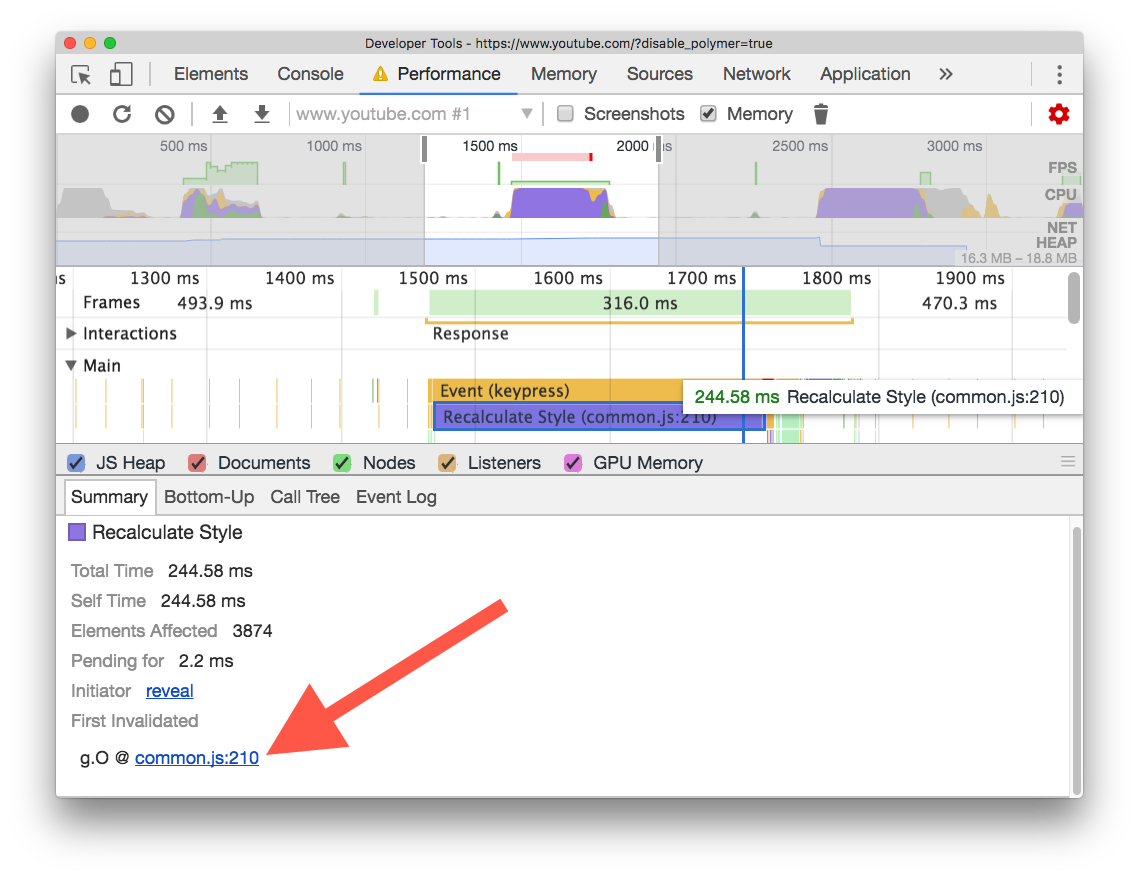
We can confirm this period of time was slow, the frame took 316 ms to execute, and ran at 3 FPS (1000 ms / 316 ms).
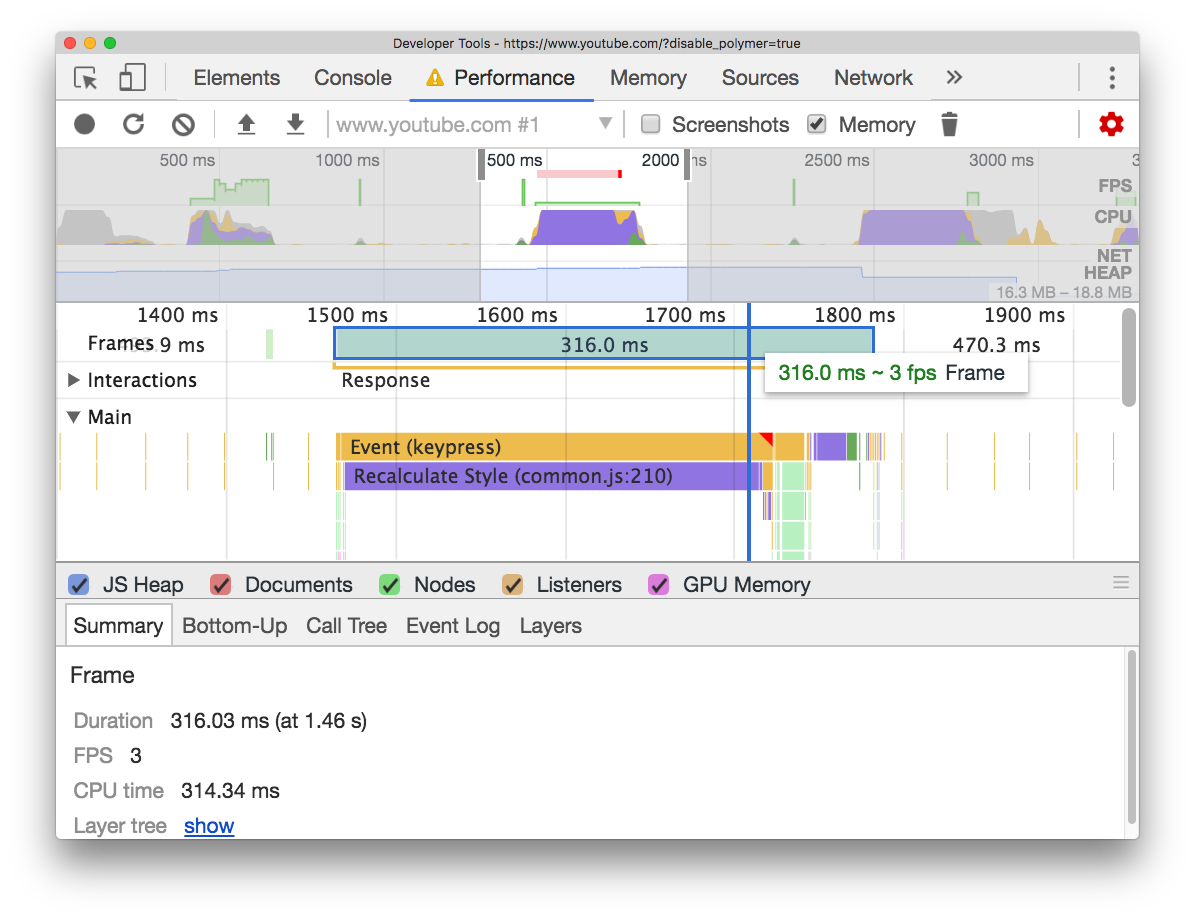
If you click on one of the slow 'events' which occurred (Recalculate Style), DevTools is able to display the code responsible for this slow event. The link is present in the summary pane, click on it.
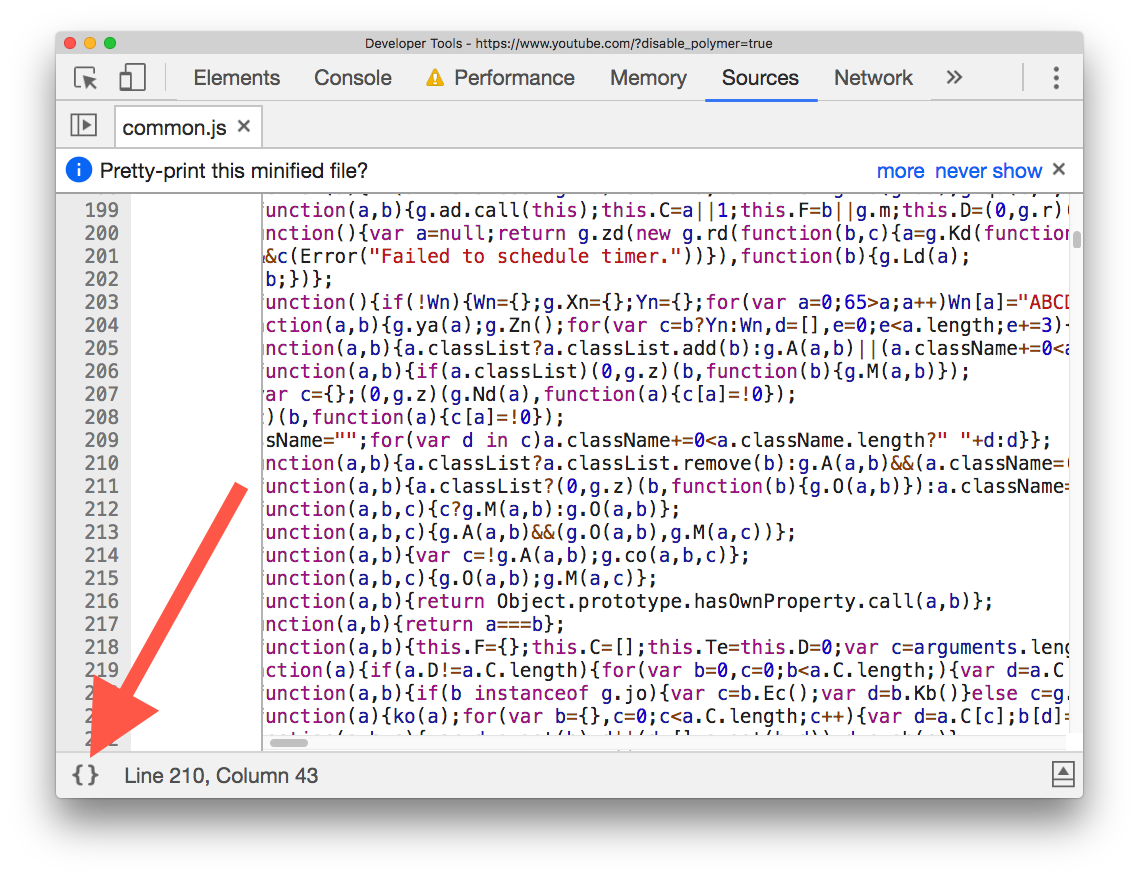
DevTools takes you to exact point in code which triggered the event. As the code is minified, you should pretty print it.
From here, the process is not always scientific. You should use your experience & common sense to figure out what could be causing the performance bottleneck.
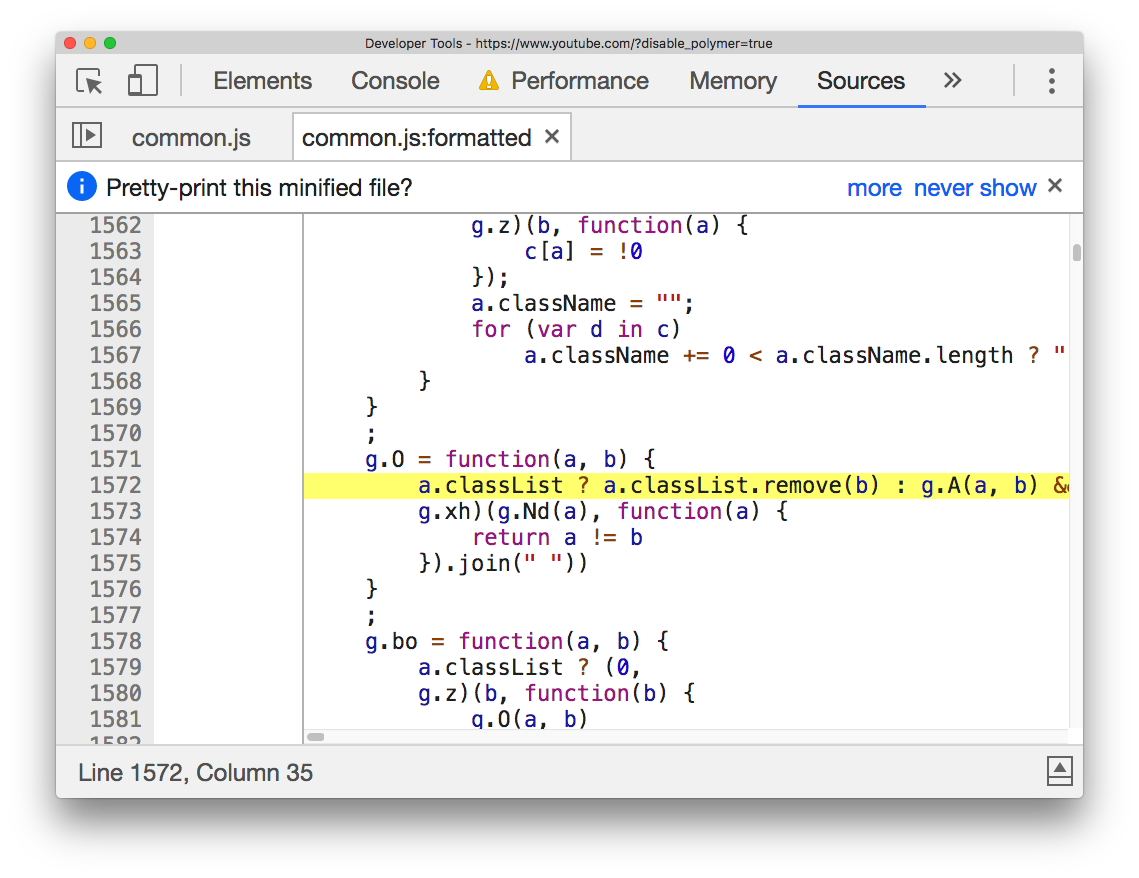
In this case, we see the responsible line of JavaScript code is:
a.classList ? a.classList.remove(b) : g.A(a, b) && (a.className = (0))
One thing which stands out is: CSS classes are being modified on an element.
Set a breakpoint on the relevant line of code. When this portion of code executes: a.classList.remove(b), we need to understand what variables a and b are exactly.

Trigger the action on the YouTube homepage again, this cases the breakpoint to trigger. When paused at a breakpoint, DevTools automatically detects variables a and b as variables of interest. Because of this, the variables are revealed in the scope pane.
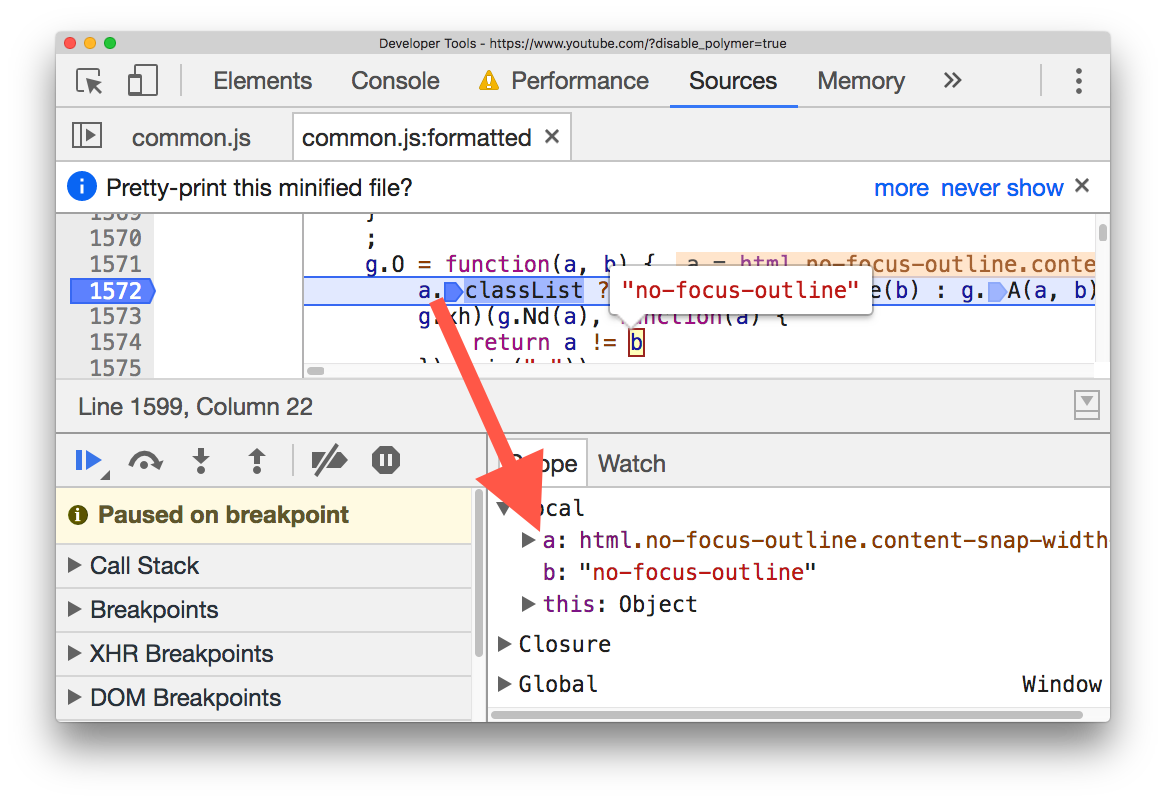
At this point, it should be clear that: variable a is the HTML element in the document, and variable b is the classname 'no-focus-outline' which is applied/removed.
When the search dropdown is triggered, a class of 'no-focus-outline' is removed from the HTML element.
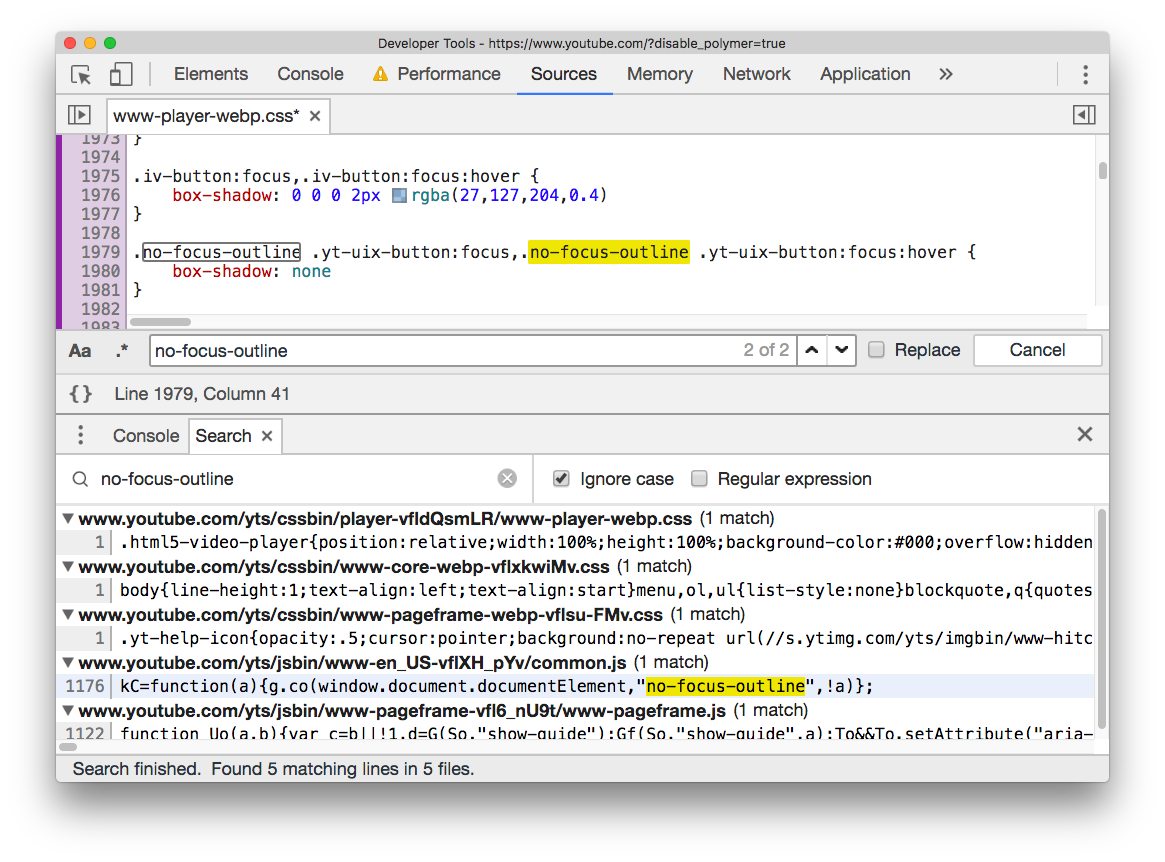
We can perform a project wide code search (Cmd + Alt + f) from the Sources Panel to understand in what ways a class of no-focus-outline affects the page.
Conclusion
The performance summary pane you saw at the start may start to make sense.
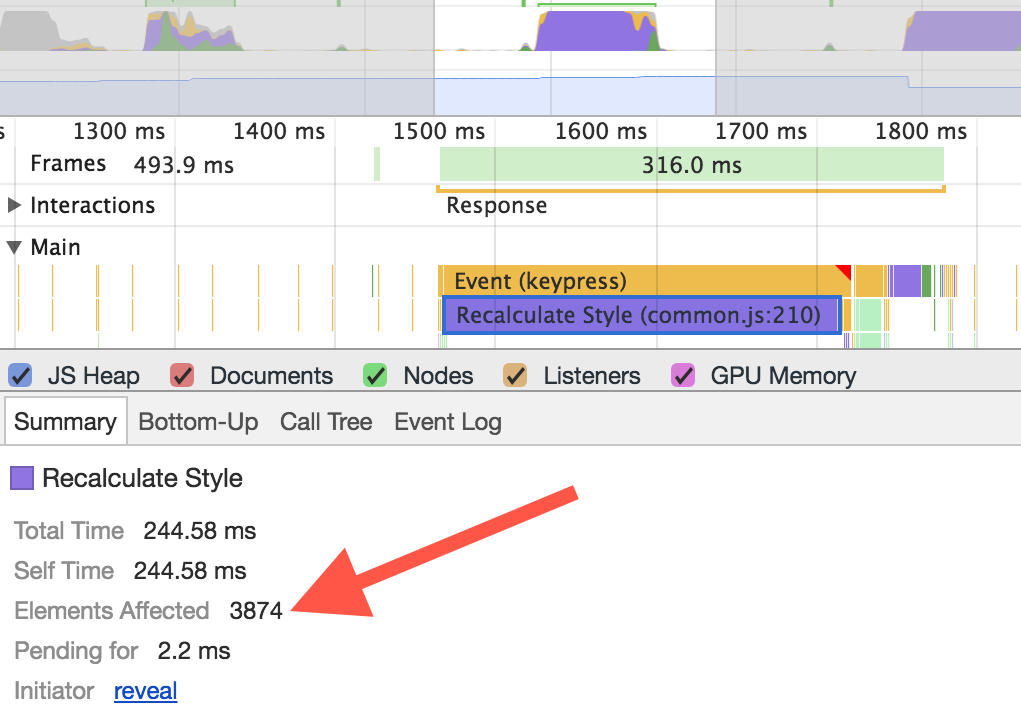
By changing the class name of an element very high up in the DOM, it has the potential to affect a large number of elements. In this case:
- The class change is on the topmost element, the HTML element.
- It affects 3874 child nodes.
- Recalculate style is triggered, this lasts for 244.58 ms.
Potential workarounds:
- Find a new shared common parent of the child nodes which has a shorter distance than the HTML element.
- It could be preferable to target the elements which need their styles changed in JavaScript directly. This could decrease maintainability however.